
📌 Article Summary (Busy? Read This First!)
- “Moderately Hard” Has Poor Cost-Performance: Recent evidence suggests that training below your Ventilatory Threshold 1 (VT1)—for example, around 10–15% slower in speed—can produce substantial aerobic adaptations in key cellular foundations (mitochondria and capillary density) while keeping overall training strain relatively low.
- Cut Out Unnecessary “Junk Fatigue”: Pushing your intensity closer to VT1 during routine easy runs may not substantially enhance the signal for key cellular adaptations, but it can significantly increase perceived exertion and overall training strain, leading to unnecessary accumulated fatigue.
- Cardiovascular vs. Musculoskeletal Needs: While low-intensity running provides a strong stimulus for mitochondrial and capillary development, building muscle–tendon stiffness (such as Achilles tendon elastic recoil) and recruiting specific higher-threshold motor unit patterns still require targeted physical stimuli at or near actual race pace.
- The Smart Strategy: A practical model is to divide your training into two distinct polarized roles: keeping the vast majority (around 80%) genuinely easy to build cellular stamina with low mechanical and perceptual strain, while reserving a smaller portion (around 20%) for high-quality, race-specific intensity to sharpen your muscles and tendons.
“I’m training hard every day, but I feel like I’m accumulating fatigue without seeing major breakthroughs…”
“I often end up settling for a middle-of-the-road, moderately hard intensity on my daily jogs…”
If this sounds like you, read on to explore how to balance low-intensity aerobic conditioning with targeted higher-intensity work, the specific numeric guidelines, and how this idea broadly aligns with classic principles like Jack Daniels’ training theory!
- Why Our “Hard Work” Sometimes Betrays Performance
- 1. The True Nature of VT1 and Its Relationship with LT1
- 2. Research Insights: Evaluating Training Below VT1
- 3. Practical Modeling: Example Target Zones (For Illustration Only)
- 4. Jack Daniels’ Theory: E-Pace and M-Pace
- 5. Cardiovascular vs. Musculoskeletal Adaptations: Why You Can’t Only Run Slow
- 6. The Polarized Hybrid Strategy
Why Our “Hard Work” Sometimes Betrays Performance
In long-distance endurance sports, there is a deeply ingrained mindset or long-standing habit that clings to athletes’ minds… do you know that feeling?
It’s the “No Pain, No Gain” mentality—the rigid belief that “training isn’t effective unless it feels somewhat tough, makes your breathing labored, and leaves your muscles burning.”
During daily jogs or endurance rides, runners, cyclists, and triathletes often catch themselves thinking, “I feel good today, so I should push the pace a bit.” We unconsciously drift into a “moderately hard” intensity where our breathing gets slightly labored. I’m guilty of this too. There’s almost a frugal instinct where we feel like we’re losing out if we don’t push as hard as we can (haha).
However, modern exercise physiology and sports science are delivering a compelling counterperspective to this old-school belief: “Hold on, that might not be entirely true.”
In this article, we will examine the physiological concepts behind VT1 (Ventilatory Threshold 1) and LT1 (Lactate Threshold 1), discuss the rationale for running noticeably below VT1 based on recent research, address the crucial musculoskeletal differences (muscles and tendons), and explore a “smart intensity control strategy” aligned with Dr. Jack Daniels’ principles (E-pace vs. M-pace).
1. The True Nature of VT1 and Its Relationship with LT1
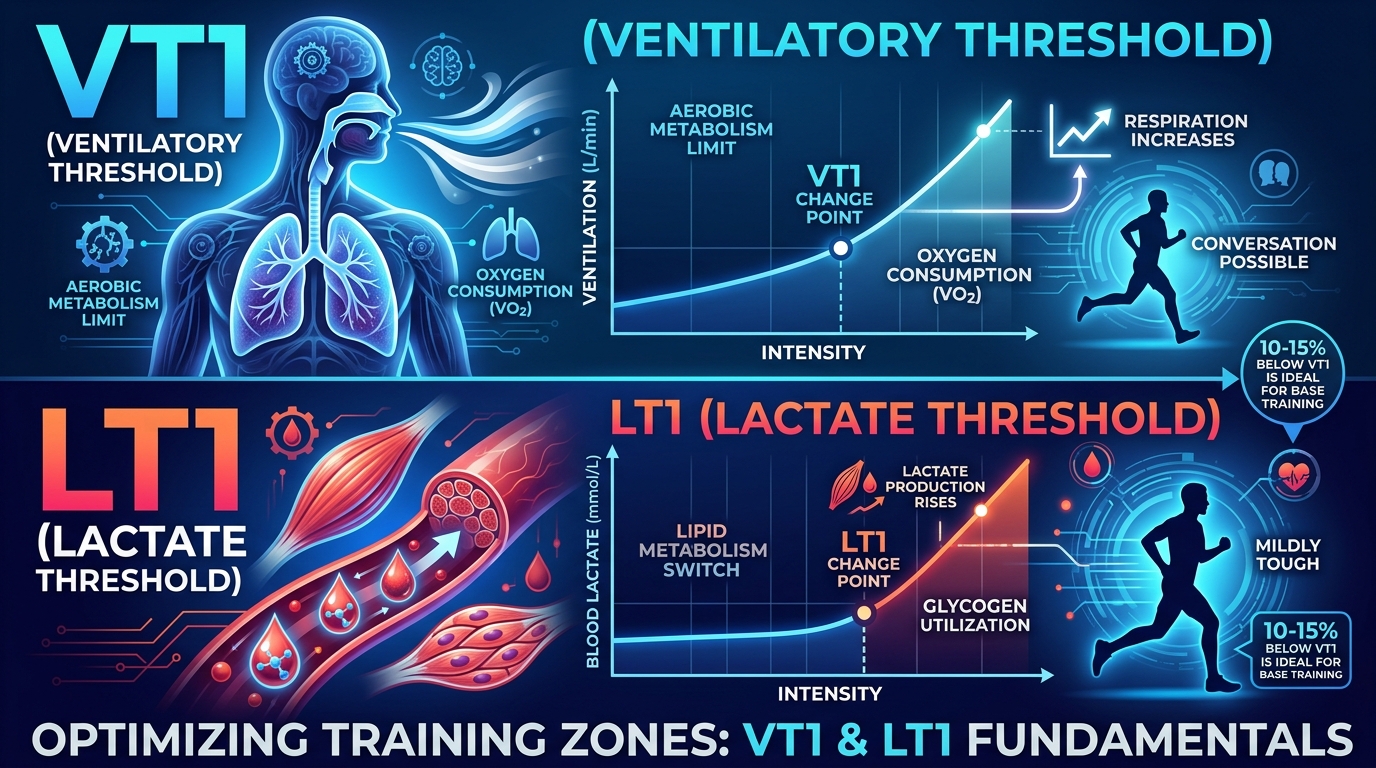
To manage training intensity correctly, we first need to understand the initial boundary where energy metabolic pathways shift during incremental exercise: VT1 (Ventilatory Threshold 1).
While many serious athletes are hyper-focused on thresholds like FTP, marathon target pace, or LT2/VT2 (the tough intensity where fatigue rapidly accumulates), long-term endurance development relies heavily on building a broad base around and below this milder boundary: VT1.
The Relationship Between VT1 and LT1
In practical daily training contexts, VT1 and LT1 often occur in a similar physiological intensity range, but they are evaluated through different physiological windows. One observes respiratory gas exchange, while the other observes blood lactate responses. They reflect related metabolic events in the body.
Here is what happens inside the body as intensity gradually rises:
① The Blood Window: LT1 (Lactate Threshold 1)
When moving at a very easy pace, the body relies on a combination of fat and carbohydrate oxidation, and blood lactate concentration remains relatively low and stable.
As exercise intensity gradually increases, carbohydrate oxidation progressively contributes a larger share of the energy demand. As carbohydrates break down, lactate production increases.
Eventually, you reach a point where blood lactate concentration clearly begins to show a systematic, sustained increase above baseline levels. This is LT1 (Lactate Threshold 1).
② The Respiratory Window: VT1 (Ventilatory Threshold 1)
What happens to your breathing when lactate accumulation begins at LT1? Here lies the physiological connection.
Increased metabolic acid production increases the demand for bicarbonate buffering ($HCO_3^-$). This buffering process generates additional carbon dioxide ($CO_2$).
When $CO_2$ production increases, the brain’s respiratory center signals for an increase in breathing to expel the gas. Consequently, ventilation begins to increase disproportionately relative to oxygen uptake, while carbon dioxide elimination remains relatively efficient. This is VT1 (Ventilatory Threshold 1).
【Physiological Transition Sequence】
Gradual Increase in Exercise Intensity
  ↓
Increased reliance on carbohydrate oxidation & lactate production 【LT1】
  ↓
Bicarbonate buffering produces additional Carbon Dioxide (CO2)
  ↓
Ventilation increases disproportionately to oxygen uptake 【VT1】
③ Lab VT1 vs. Field LT1: Why Two Terms Exist
The reason these two terms coexist in endurance literature comes down to differences in measurement environments and equipment:
- VT1 (Ventilatory Threshold 1): Measured primarily in university research labs or specialized performance centers. Athletes wear a metabolic mask to analyze breath-by-breath oxygen consumption ($VO_2$) and carbon dioxide output ($VCO_2$). It is highly precise but requires specialized laboratory equipment.
- LT1 (Lactate Threshold 1): Measured primarily in field settings (tracks or trainers). Intensity is increased step-by-step, and blood samples are taken from an earlobe or fingertip to plot blood lactate concentration using a portable analyzer.
Although measured differently, both serve as practical markers of the transition from lower-intensity aerobic metabolism toward higher metabolic strain.
④ Subjective Intensity & The Talk Test
Even without expensive lab gear, you can estimate VT1 using subjective cues like the Talk Test:
- Below VT1 (Low-Intensity Aerobic Zone): Breathing is fully controlled, and nasal breathing can often be maintained effortlessly. You can easily carry on a full conversation with a partner for hours without getting winded.
- At the VT1 Boundary: Nose breathing alone becomes difficult, and mouth breathing naturally mixes in. Conversation remains possible, but speaking continuously becomes noticeably less comfortable.
On subjective exertion scales (such as the Borg scale), the transition from “Easy” to “Somewhat Hard” typically marks this VT1 boundary. Note that while nasal breathing is a useful practical cue, it is a subjective guideline rather than a laboratory-validated diagnostic test.
⑤ Difference Between the First and Second Thresholds
It is crucial not to confuse VT1 with the second, more famous threshold: VT2 (Ventilatory Threshold 2) / LT2 (Lactate Threshold 2). The intensity trained in “threshold runs” or “FTP tests” corresponds to this second threshold.
| Metric | First Threshold Range (VT1 / LT1) | Second Threshold Range (VT2 / LT2) |
|---|---|---|
| Physiological State | Upper limit of low-intensity aerobic domain | Boundary above which metabolic stability cannot be sustained |
| Blood Lactate | Begins a systematic rise above baseline | Rapid accumulation / exponential rise |
| Breathing Response | Slight increase in ventilation relative to $VO_2$ | Pronounced hyperventilation ($VE/VCO_2$ rises) |
| Talk Test | Short sentences are possible | Only single words (“stop”, “hard”) |
| Sustainable Duration | Several hours (until fuel depletion) | Limited duration; sustainable time varies substantially between individuals |
For long-distance performance, raising the workload that can be sustained at or below VT1 (running faster without exceeding VT1) is one important component of overall endurance development.
2. Research Insights: Evaluating Training Below VT1
Now that we understand the importance of VT1, how should we structure our daily training intensity? Recent research offers valuable perspective on how light easy training can be while remaining effective.
① Why Light Intensities Stimulate Cellular Adaptation
Why does a light jog with easy breathing stimulate aerobic development? The answer lies in the adaptive triggers for mitochondria and capillary growth.
A combination of repeated muscle contraction, metabolic stress, and vascular signals (such as shear stress from blood flow) contributes to mitochondrial and capillary adaptations in skeletal muscle.
Low-intensity training below VT1 provides a strong, effective stimulus for these adaptations. Increasing intensity closer to VT1 increases carbohydrate reliance and perceptual strain, but available evidence does not show that it proportionally enhances these low-intensity cellular adaptation signals. Pushing harder may simply add unnecessary fatigue.
② “Harder Effort Is Not Always More Productive”
We often treat workout difficulty as proof of productivity: “Today’s session was tough, so I must be making great gains!”
However, extra difficulty on easy days may simply be “Junk Fatigue”—stress that wears down your overall recovery capacity and degrades the quality of subsequent workouts without providing proportional adaptive returns.
For endurance athletes managing high weekly volume, relying on genuinely easy runs to build aerobic base is a smart method to manage fatigue and avoid overtraining.
3. Practical Modeling: Example Target Zones (For Illustration Only)
To visualize how to translate this concept into practical numbers (pace, power, heart rate), let’s look at an illustrative model athlete:
- Benchmark Goal Runner: 5,000m in 20:00 (Race Pace: 4:00/km)
- Assumed Cycling FTP: 240 W
- Heart Rate Profile: Max HR 180 bpm | Resting HR 50 bpm ($\text{HRR} = 130\text{ bpm}$)
(Note: VT1 cannot be mathematically calculated from race times alone and varies individually. The numbers below are strictly for illustrative demonstration).
① Running Pace Target (Pace vs. Speed Conversion)
For illustration, assume this runner’s measured or estimated VT1 running speed is approximately 4:50/km (12.41 km/h):
When converting a 10% to 15% reduction in running speed (12.41 km/h):
- 10% Slower Speed (11.17 km/h): ~5:22 /km
- 15% Slower Speed (10.55 km/h): ~5:41 /km
| Intensity Level | Speed / Pace Target | 10km Time | Subjective Feel & Breathing |
|---|---|---|---|
| Assumed VT1 | 12.41 km/h (~4:50 /km) | ~48:20 | Moderate focus required; sentence pauses |
| 10% Slower Speed | 11.17 km/h (~5:22 /km) | ~53:00 | Comfortable, controlled easy jog |
| 15% Slower Speed | 10.55 km/h (~5:41 /km) | ~55:30 | Genuinely easy; comfortable nasal breathing |
For an athlete capable of 4:00/km in a 5K, running at 5:30–5:40/km may feel exceptionally slow—triggering that “frugal instinct” that it’s too easy (haha). However, cellular aerobic adaptation remains highly effective at this speed while keeping fatigue minimal.
Note on Practical Application: I suggest thinking in terms of roughly 10–15% below VT1 as a practical, flexible target range for daily easy training.
② Cycling Power Guidelines (FTP: 240W)
For illustration, assume this athlete’s VT1 cycling power is 180 W:
- Assumed VT1 Power: ~180 W (Upper Zone 2; moderate pedal resistance)
- 10% Below VT1 Power: ~162 W (Mid Zone 2; comfortable, sustainable effort)
- 15% Below VT1 Power: ~153 W (Lower Zone 2; light pedal feel)
While running and cycling involve different biomechanical demands, applying a 10–15% buffer below VT1 power on easy riding days provides a similar practical guideline to limit fatigue.
③ Heart Rate Guidelines (Karvonen HRR Method: Max 180 / Rest 50)
Heart rate helps monitor internal physiological strain against changing environmental conditions. Using the Karvonen formula ($\text{Target HR} = (\text{Max HR} – \text{Resting HR}) \times \text{Intensity \%} + \text{Resting HR}$):
\text{Target HR} = (180 – 50) \times \text{Intensity \\%} + 50
For illustration, assume this athlete’s VT1 corresponds to approximately 65–70% HRR:
| Intensity Level | Karvonen % HRR | Target Heart Rate | Subjective Feel |
|---|---|---|---|
| Assumed VT1 Range | HRR 65% – 70% | 134 – 141 bpm | Transition to mouth breathing |
| 10% Below Range | HRR 59% – 62% | 126 – 130 bpm | Completely relaxed |
| 15% Below Range | HRR 55% – 59% | 121 – 126 bpm | Low 120s bpm; low-strain safety zone |
Staying within this lower heart rate range helps ensure that easy workouts remain genuinely low-strain, leaving you fresh for targeted high-intensity sessions.
4. Jack Daniels’ Theory: E-Pace and M-Pace
This physiological approach connects nicely with Dr. Jack Daniels’ classic philosophy in Daniels’ Running Formula.
① E-Pace and M-Pace Definitions
In Daniels’ VDOT system:
- M-Pace (Marathon Pace): Marathon-specific pace used to develop familiarity, pacing discipline, and efficiency at goal marathon pace near the upper aerobic domain.
- E-Pace (Easy Pace): Designed to build aerobic base, capillaries, and structural resilience at a comfortable intensity.
② “Physiological Effects Are Similar”
Dr. Daniels noted in his text:
“The main effect of M running is psychological, getting used to the pace you hope to run in a race… The physiological benefits of M running are no different from E running.”
— Daniels’ Running Formula
His message is clear: if your goal is building aerobic foundation, you don’t need to force daily jogs into a tougher marathon pace. Genuinely easy E-pace running delivers similar cellular aerobic benefits with far lower fatigue.
③ Comparing the Numbers
Comparing the numbers for a 20:00 5K runner (VDOT 50.1):
- Daniels’ M-Pace: 4:29 – 4:39 /km
- Daniels’ E-Pace Range: 5:01 – 5:39 /km
- 15% Speed Reduction Pace: ~5:27 – 5:39 /km
The slower end of Daniels’ E-pace (5:39/km) overlaps nicely with a 15% speed reduction from an estimated VT1. While Daniels’ E-pace was developed independently of a fixed percentage below VT1, this overlap highlights a shared practical truth: easy runs can be surprisingly slow while remaining highly effective.
④ The Danger of “Over-Pushing” Easy Days
Dr. Daniels warns against a common mistake: turning easy runs into moderately hard efforts. When given an E-pace range of 5:01 to 5:39/km, athletes often push toward 5:01/km or faster, thinking faster is always better.
However, there is no reason to assume that simply running at the faster end of E-pace automatically produces proportionally greater aerobic adaptation, whereas it certainly increases overall fatigue and training stress.
5. Cardiovascular vs. Musculoskeletal Adaptations: Why You Can’t Only Run Slow
After learning about easy running, you might think: “Great, I’ll do 100% of my workouts at an easy pace!”
However, endurance performance depends on more than just cardiovascular cellular adaptations. Building musculoskeletal resilience and neuromuscular coordination requires faster running at or near race pace.
① Achilles Tendon Stiffness and Elastic Recoil
Running relies heavily on elastic energy storage and return (elastic recoil) in the Achilles tendon and foot structure.
Slower running generally involves lower running speeds and different force–time characteristics. In contrast, higher-speed running provides a stronger and more race-specific mechanical stimulus to the muscle–tendon unit, stimulating tendon stiffness and responsive energy return.
If an athlete only runs slowly, their cardiovascular system may be fit, but their musculotendinous system may lack the specific spring stiffness needed to sustain faster speeds efficiently.
② Muscle Recruitment and Motor Unit Adaptations
Skeletal muscle fibers range from Type I (Slow-Twitch) to higher-threshold Type IIa fibers.
Higher-intensity running can provide an additional stimulus for recruiting higher-threshold motor units and developing the neuromuscular characteristics needed for faster running. To condition these motor units for race-day fatigue resistance, you must periodically expose them to race-pace intensities.
【Exercise Intensity & Muscle Fiber Recruitment】
Slow Easy Jog ─── Type I [●●●●●] + Higher-Threshold [      ] (Dormant)
Fast Race Pace ── Type I [●●●●●] + Higher-Threshold [★★★   ] (Recruited!)
③ Joint, Bone, and Connective Tissue Resilience
Low-intensity running provides repeated mechanical loading that contributes to musculoskeletal adaptation and durability. This repeated, lower-impact loading helps build a durable structural chassis that may improve tolerance to subsequent higher-intensity mechanical loading.
④ Cycling Mechanics and TT Position
On the bike, higher race-pace wattages train core stability, hip muscle coordination under pedal resistance, and the specific muscle endurance required to hold an aerodynamic TT position comfortably.
6. The Polarized Hybrid Strategy
A practical approach is to polarize the training load: balancing genuinely easy running for cellular foundation with targeted race-pace work for mechanical and neuromuscular sharpness.
 ┌─────────────────────────────────────────────────────────────┐
 │                    TOTAL TRAINING PROGRAM                   │
 └──────────────────────────────┬──────────────────────────────┘
                                │
         ┌──────────────────────┴──────────────────────┐
         ▼                                             ▼
 ~80% EASY / CELLULAR BASE                     ~20% QUALITY WORK
 (e.g., ~10–15% below VT1 speed)               (At or above race pace)
 • Substantial aerobic conditioning            • Stronger muscle–tendon stimulus
 • Minimal perceptual & overall strain         • Recruits higher-threshold motor units
 • Preserves freshness for quality days        • Refines race-pace coordination
(Note: The 80/20 split serves as one practical model for structuring training, rather than a universal prescription).
💡 Execution Blueprint (For the Illustrative Athlete Above)
- ~80% Easy Days (Cellular Base): Target intensities noticeably below VT1 (e.g., 5:30–5:40/km, low 120s HR, 150–160W for our model athlete). Keep it genuinely easy without letting ego dictate the pace.
- ~20% Quality Days (Musculoskeletal Sharpness): Arrive at key workout days with fresh legs to perform race-pace efforts with sharp form, strong tendon recoil, and high focus.
Conclusion: “Slow and Steady Wins the Race”
The biggest mistake in endurance training is falling into the “gray zone”—where every workout is moderately hard, leading to chronic, middle-of-the-road fatigue.
By keeping easy days genuinely easy and quality days sharp, you maximize adaptation while managing overall fatigue. Leave your ego at the door on easy days, drop the pace with confidence, and let those low-strain miles build the ultimate foundation for race day!
References
- The Relationship Between Lactate and Ventilatory Thresholds in Runners. PubMed (PMID: 30319439)
- Training-Intensity Distribution on Middle- and Long-Distance Runners: A Systematic Review. PubMed (PMID: 34749417)
- Effects of Exercise Training on Mitochondrial and Capillary Growth in Human Skeletal Muscle: A Systematic Review and Meta-Regression. PubMed (PMID: 39390310)
コメント