
- Introduction
- Chapter 1: Where Did the Idea of “High Responders” and “Low Responders” Come From?
- Chapter 2: The Role of Genetics and Its Limits
- Chapter 3: Measurement Error and the Illusion of “Non-Response”
- Chapter 4: External Load vs. Internal Load
- Chapter 5: Cellular Signaling and Molecular Adaptations
- Chapter 6: Is “80%” Truly 80% for Everyone?
- Chapter 7: The Cumulative Effect of Training History
- Chapter 8: Practical Ways to Monitor Individual Adaptation
- Conclusion
- References
Introduction
In sports science, it has long been recognized that even when people perform the exact same training program, the magnitude of adaptation can vary significantly from person to person. For a long time, the prevailing interpretation seemed straightforward: some individuals show substantial cardiorespiratory and metabolic gains from a given program, while others show little or no change at all.
However, more recent research has shown that this binary view is too simple. The simplistic label of “non-responder” is increasingly being challenged, prompting researchers to look much more closely at what actually happens beneath the surface of systemic test metrics. To truly understand why responses differ so widely, we need to look beyond the surface of a training program and examine the intricate interplay between technical measurement error, biological day-to-day fluctuation, internal versus external load, historical training background, and the unique molecular environment of skeletal muscle tissue.
Chapter 1: Where Did the Idea of “High Responders” and “Low Responders” Come From?
The concept of individual variability in training response often traces back to landmark studies in exercise physiology that attempted to quantify human trainability. Among them, the HERITAGE Family Study remains one of the most influential investigations into how human bodies respond to standardized endurance training protocols.
In the HERITAGE Family Study, hundreds of participants underwent a rigorously standardized, supervised endurance training program over a 20-week period. When researchers analyzed the changes in VO₂max—which represents the maximum rate at which the body can take in, transport, and utilize oxygen during exercise—a striking divergence emerged. While some individuals showed little or no change in their cardiorespiratory fitness despite weeks of consistent exercise, others increased their VO₂max by more than 1 L/min.
This dramatic spread in outcomes helped establish the widespread idea that human populations are neatly divided into high responders and low responders. At this point, however, it becomes clear that dividing people simply into “those who improve” and “those who don’t” is deeply problematic. A closer look reveals that a flat metric in one specific test does not automatically mean the body has remained entirely indifferent to the physiological stimulus.
Chapter 2: The Role of Genetics and Its Limits
Genetic factors contribute substantially to individual differences in many physiological traits relevant to exercise performance, including baseline VO₂max, muscle fiber type distribution, cardiovascular architecture, and skeletal muscle metabolic enzyme profiles.
Heritability estimates often suggest that a significant percentage of the variance in baseline traits can be attributed to hereditary factors. However, heritability is frequently misunderstood by the public and even within fitness discussions. It does not mean that for any given individual, a fixed percentage of your physiological capacity is rigidly predetermined by your DNA from birth. Importantly, heritability depends entirely on the population and environmental conditions being studied, describing population variance in a specific context rather than acting as an unchangeable destiny stamped onto a single person.
Furthermore, a critical distinction must be made between baseline fitness and training trainability. Having a lower baseline does not automatically mean an inferior biological ability to adapt. Recognizing genetic differences is very different from concluding that genes dictate a rigid ceiling beyond which improvement is impossible. Genetics set a broad landscape of probabilities, but they do not write a fixed script for every daily physiological adaptation, which remains heavily influenced by training history, sleep quality, daily nutrition, and life stress.
Chapter 3: Measurement Error and the Illusion of “Non-Response”
When evaluating whether someone has adapted to a training block, we rely heavily on standardized testing protocols. Yet, data can be deceiving if methodological noise is ignored entirely.
VO₂max can be measured under highly standardized laboratory conditions, but the measurement is never perfectly reproducible. Measurement devices, calibration variance, and testing protocols themselves introduce a measurable degree of technical error. Furthermore, biological noise fluctuates daily. Factors such as sleep quality, nutritional state, caffeine intake, accumulated fatigue, body temperature, psychological state, and individual motivation or effort during the test can all skew a single test result in either direction.
This brings us to the fundamental importance of incorporating a control group in training studies. If an untrained control group shows changes of a few percent over the same period simply due to biological fluctuation and measurement error, a participant designated as a “non-responder” might simply be sitting within the normal margin of error of the testing procedure itself.
A critical study by Montero and Lundby (2017) challenged the traditional “non-responder” label directly. They demonstrated that individuals who showed no improvement in VO₂max after a standard block of training often experienced significant improvements when the training volume or dose was subsequently altered or increased. More recent systematic reviews and individual participant data meta-analyses have also questioned how much of the observed variation in training response reflects true biological differences. When measurement error and within-individual variability are taken into account, some of the apparent differences between individuals become considerably smaller (Bonafiglia et al., 2022; Renwick et al., 2024). Labeling someone a “non-responder” often just means that no meaningful improvement was detected in a particular metric, over a particular period, at a particular training dose. It may indicate that the training dose or protocol was insufficient to produce a detectable change, rather than an absolute biological inability to adapt.
Chapter 4: External Load vs. Internal Load
One of the most persistent oversights in training analysis is the fundamental confusion between external load and internal load.
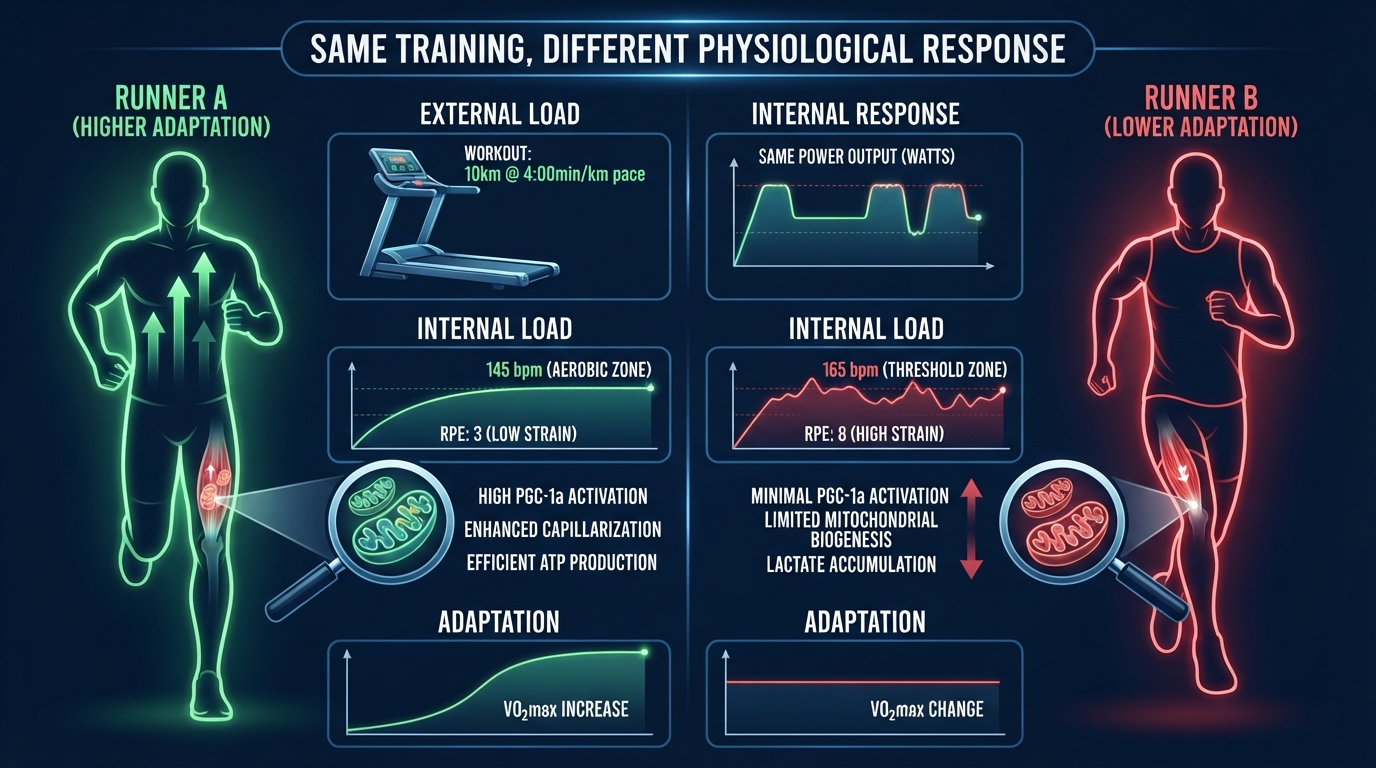
External load refers to the objective work performed—such as running pace, power output in watts, or total distance covered. For instance, if two athletes are assigned to run 10 km in 50 minutes, they are performing the exact same external load on paper. Internal load, however, refers to the actual physiological strain experienced by the body in response to that work.
Suppose, for example, that both runners have a lactate threshold heart rate of around 150 bpm. On a given day, Runner A completes the 10 km run averaging 145 bpm with a Rating of Perceived Exertion (RPE) of 3, while Runner B completes the exact same pace averaging 165 bpm with an RPE of 8. In that case, Runner A may be exercising comfortably below their threshold, while Runner B is exercising well above their threshold and experiencing substantially greater physiological strain.
Even if two athletes complete the exact same external workload, the internal stress can be entirely different. Factors like heart rate, oxygen uptake, blood lactate accumulation, ventilatory response, RPE, and perceived fatigue provide clues about the physiological stress generated by the exercise. If the internal load diverges wildly between two people doing the same external workout, it is entirely logical that their long-term adaptations will also diverge. The “same training” was never the same biological stimulus for both individuals.
Chapter 5: Cellular Signaling and Molecular Adaptations
Beneath the surface of systemic whole-body responses, every single training session triggers a complex and cascading network of molecular signals inside the muscle cells. When muscle contractions occur, they create ATP demand, energetic disturbances, calcium signaling fluctuations, mechanical tension, and cellular stress that activate various kinases and transcription factors, including AMPK, CaMK, and p38 MAPK.
Among these, factors such as PGC-1α play an integrative role in regulating cellular networks associated with energy metabolism. PGC-1α plays an important role in endurance training by linking acute contractile activity to longer-term adaptations such as mitochondrial biogenesis and enhanced oxidative metabolic capacity.
However, the magnitude and pattern of these molecular responses can vary depending on the physiological state of the muscle and the characteristics of the exercise stimulus. These signaling events contribute to changes in gene expression over time, but molecular activation does not automatically translate into linear, long-term systemic adaptation without adequate recovery and progressive overload. This is one reason why individualized training is not as simple as assigning different numbers to different people; the same exercise prescription can produce different molecular responses depending on the specific physiological state of the muscle tissue.
Chapter 6: Is “80%” Truly 80% for Everyone?
Training prescription is frequently built on standardized percentage-based models—such as percentages of maximal heart rate (%HRmax), functional threshold power (FTP), or maximal oxygen uptake (%VO₂max). While these percentages offer a practical framework for organization, they carry a hidden structural flaw.
The same percentage does not necessarily represent the same physiological intensity across different athletes. Mann et al. (2013) highlighted that utilizing identical relative intensity prescriptions does not necessarily impose the same physiological stress across individuals. For instance, prescribing training at 80% of VO₂max or HRmax does not necessarily produce the same metabolic or ventilatory response in every athlete.
In reality, due to individual differences in metabolic characteristics, lactate dynamics, and muscle characteristics, two athletes exercising at the same relative intensity may be positioned differently with respect to their aerobic or anaerobic thresholds. One may remain below a given metabolic threshold, while another may be closer to or above it. The percentage is a clean mathematical abstraction, but the physiological toll is always biological and individual.
Chapter 7: The Cumulative Effect of Training History
There is another important factor: the human body carries the cumulative effects of its previous training history. Today’s workout is never performed by a body starting from zero; it is performed in a body shaped by everything that came before it.
Two athletes might execute an identical workout today, but if Athlete A has accumulated years of high-volume aerobic base work while Athlete B has only recently transitioned from a sedentary lifestyle, the physiological demands and internal processing of that workout may be quite different. The structural resilience of tendons, the capillary density within the muscle beds, glycogen storage capacity, and the enzymatic profile built over years alter how physical stress is absorbed, managed, and cleared.
Training adaptation is therefore best understood as a continuous, dynamic process shaped by the body’s changing state over time. A workout is performed in a body shaped by past training, cumulative fatigue, sleep quality, nutritional habits, recovery, and ongoing adaptation.
Chapter 8: Practical Ways to Monitor Individual Adaptation
Given that standardized programs and generic percentages fail to capture the full picture of individual physiology, how should athletes and coaches monitor progress without falling into the trap of rigid, simplistic categorization?
Rather than judging success solely by whether a specific workout was completed on paper, longitudinal monitoring should focus on the dynamic relationship between external and internal metrics over time:
- How is heart rate changing at the same objective pace?
- How is RPE changing at the same power output?
- Can you run faster at the exact same heart rate than before?
- Can you maintain the same power output at a lower heart rate than before?
RPE provides valuable information about how demanding the training actually felt, capturing integrated central and peripheral fatigue that isolated physical metrics might miss. Furthermore, adaptation also depends on recovery markers. Changes in resting heart rate, heart rate variability, and other recovery indicators can also provide useful context, particularly when interpreted alongside training performance and perceived fatigue. Ultimately, the most useful information is often not an isolated number, but the relationship between several indicators and how those relationships shift over time.
Conclusion
The same training can produce different adaptations across a population, but that does not mean that some people are simply fixed “responders” and others are genetically destined never to improve.
Measurement error, day-to-day biological variation, training history, recovery status, and the actual physiological stimulus produced by a workout all matter profoundly. Most importantly, the same external load does not necessarily create the same internal load. That is why training should not be judged only by whether the prescribed menu was completed. We should also ask how the body responded: how pace relates to heart rate, how power relates to RPE, how quickly fatigue resolves, and how these relationships change over time.
A successful training program is therefore not simply a rigid menu to copy blindly. It is a starting point. The real work lies in observing the body’s response and adjusting the next stimulus accordingly. The same training does not necessarily produce the same adaptation. And perhaps the more fundamental question is whether “the same training” was ever the same stimulus to begin with.
References
- Bouchard, C., et al. (1999). Familial aggregation of VO₂max response to exercise training: Results from the HERITAGE Family Study. Journal of Applied Physiology, 87(3), 1003–1008. https://doi.org/10.1152/jappl.1999.87.3.1003
- Montero, D., & Lundby, C. (2017). Refuting the myth of non-response to exercise training: ‘non-responders’ do respond to higher dose of training. The Journal of Physiology, 595(11), 3377–3387. https://doi.org/10.1113/JP273480
- Bonafiglia, J. T., et al. (2022). Interindividual Differences in Trainability and Moderators of Cardiorespiratory Fitness, Waist Circumference, and Body Mass Responses: A Large-Scale Individual Participant Data Meta-analysis. Sports Medicine, 52(12), 2837–2851. https://doi.org/10.1007/s40279-022-01725-9
- Renwick, J. R. M., Preobrazenski, N., Wu, Z., et al. (2024). Standard Deviation of Individual Response for VO₂max Following Exercise Interventions: A Systematic Review and Meta-analysis. Sports Medicine, 54(12), 3069–3080. https://doi.org/10.1007/s40279-024-02089-y
- Mann, T. N., Lamberts, R. P., & Lambert, M. I. (2013). Methods of prescribing relative exercise intensity: Physiological and practical considerations. Sports Medicine, 43(7), 613–625. https://doi.org/10.1007/s40279-013-0045-x
- Egan, B., & Zierath, J. R. (2013). Exercise metabolism and the molecular regulation of skeletal muscle adaptation. Cell Metabolism, 17(2), 162–184. https://doi.org/10.1016/j.cmet.2012.12.012

コメント